
The median formula for n values in order is: the -th value when n is odd, and the average of the -th and -th values when n is even. For grouped data, class 10 uses , with each letter explained below.
This guide puts the mean, median and mode formulas side by side, for raw lists and for frequency tables, then adds the arithmetic, geometric and harmonic means and the weighted average. One frequency table is solved by every method so you can see how the answers relate. Paste your own numbers into the statistics calculator below to check homework.
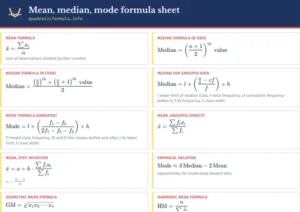
Key formulas
Mean formula
sum of observations divided by their number
Median formula (n odd)
Median formula (n even)
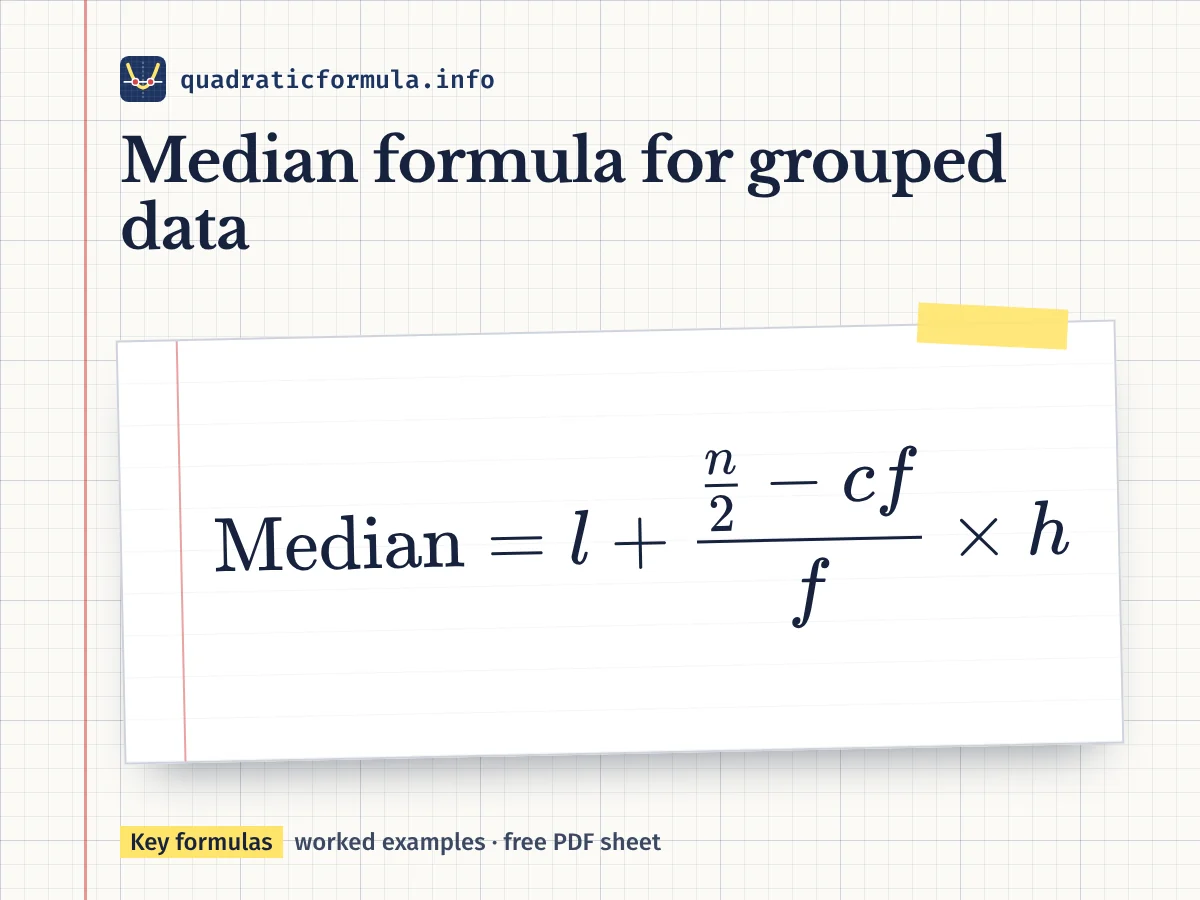
Median for grouped data
l lower limit of median class, n total frequency, cf cumulative frequency before it, f its frequency, h class width
Mode formula (grouped)
f1 modal class frequency, f0 and f2 the classes before and after, l its lower limit, h class width
Mean, grouped (direct)
Mean, step deviation
Empirical relation
approximate, for moderately skewed data
Geometric mean formula
Harmonic mean formula
What does mean in math, and how median and mode differ
Students often ask what does mean in math stand for. The mean is the everyday average: add all the values and share the total equally. The median is the middle value once the data is sorted. The mode is the value that appears most often. All three are called measures of central tendency, because each tries to describe the whole data with a single typical number.
| Measure | What it uses | Best when |
|---|---|---|
| Mean | Every value | Data is fairly even, with no extreme values |
| Median | Only the position of the middle value | A few very large or small values would pull the mean (salaries, house prices) |
| Mode | Only the most frequent value | You want the most popular choice (shoe size, shirt size) |
Take the incomes 12, 14, 15, 16 and 93 thousand rupees. The mean is 30 thousand, which describes nobody in the list. The median, 15 thousand, describes the group far better.
Median formula for ungrouped data (odd and even n)
First arrange the values in ascending order. Skipping this step is the single biggest reason for wrong medians.
Odd number of values
Find the median of 12, 7, 19, 5, 15, 9, 21.
Sorted: 5, 7, 9, 12, 15, 19, 21. Here , so the median is the th value.
Answer: median = 12.
Even number of values
Find the median of 14, 8, 20, 11, 17, 6, 23, 10.
Sorted: 6, 8, 10, 11, 14, 17, 20, 23. Here , so take the 4th and 5th values, 11 and 14.
Median .
Answer: median = 12.5. With an even count, the median need not be one of the data values.
Mean formula for lists and frequency tables
The formula of mean for a plain list is . The mean of 3, 8, 10, 15 is . This is also the arithmetic mean formula, and the average formula in maths that you use for marks, runs or temperatures.
For a frequency table, the class 10 Statistics chapter teaches three methods. Each class is replaced by its class mark (the mid-point).
- Direct method: .
- Assumed mean method: choose a class mark near the centre, let , then .
- Step deviation method: divide the deviations by the class size , , then .
The three methods always give the same mean. The second and third only shrink the numbers so the multiplication is quicker. The same column is reused for variance on the standard deviation formula page.
One frequency table solved for mean, median and mode
Daily travel time (minutes) of 40 office workers:
| Class | ||||
|---|---|---|---|---|
| 10 to 20 | 3 | 15 | ||
| 20 to 30 | 8 | 25 | ||
| 30 to 40 | 15 | 35 | 0 | 0 |
| 40 to 50 | 9 | 45 | 1 | 9 |
| 50 to 60 | 5 | 55 | 2 | 10 |
| Total | 40 | 5 |
Mean by step deviation
With and : .
Check by the direct method: , and .
Answer: mean = 36.25 minutes.
Median for grouped data
Cumulative frequencies: 3, 11, 26, 35, 40. Here . The first cumulative frequency that reaches 20 is 26, so the median class is 30 to 40.
So , (the class before), , .
Answer: median = 36 minutes.
Mode for grouped data
The highest frequency is 15, so the modal class is 30 to 40. Then , , (class before), (class after).
Answer: mode is about 35.38 minutes.
Median formula for grouped data, term by term
This is the median formula class 10 students use in board exams. Every letter refers to the median class, the class whose cumulative frequency first reaches or crosses .
- : lower limit of the median class.
- : total frequency, . Use here, not , whether n is odd or even.
- : cumulative frequency of the class just before the median class.
- : frequency of the median class itself.
- : class size (width).
The idea is linear interpolation. You know values lie below , and you need more of the values spread evenly across a width of .
Common mistake: classes such as 10 to 19, 20 to 29 are not continuous. Convert them to 9.5 to 19.5, 19.5 to 29.5 first, otherwise and are wrong.
Mode formula and the empirical relation
For ungrouped data, the mode is simply the most frequent value. In 3, 5, 7, 5, 9, 7, 5, 2 the value 5 appears three times, so the mode is 5. A list can have two modes (bimodal) or none.
The formula of mode for grouped data, , is the mode formula class 10 uses. Here is the frequency of the modal class and are the frequencies of its neighbours. If the modal class is the first class, take .
For a moderately skewed distribution, the three averages are linked by Karl Pearson's empirical relation:
From the table above: , close to the 35.38 found directly. Use it when a question gives two of the three and asks for the third. For a perfectly symmetric distribution, mean, median and mode are equal.
Arithmetic, geometric and harmonic mean formulas
For positive numbers :
| Mean | Formula | For 4 and 9 |
|---|---|---|
| Arithmetic (AM) | 6.5 | |
| Geometric (GM) | 6 | |
| Harmonic (HM) |
Two facts worth memorising for sequences and series questions: , with equality only when all numbers are equal, and for two numbers . Check: .
The geometric mean of two numbers is also called the mean proportional. The mean proportional formula between a and b is , so between 4 and 9 it is 6, because . For three numbers, the GM of 2, 8, 32 is . Use the harmonic mean for average speed over equal distances: 40 km/h one way and 60 km/h back gives km/h, not 50.
Weighted average formula
When some values count more than others, multiply each by its weight:
A student scores 78 in a test worth 3 credits, 85 in one worth 4 credits and 62 in one worth 2 credits. Weighted average . The plain average of the three marks would be 75, which ignores the credits. The grouped mean is a weighted average where the frequencies are the weights. For marks written as a share of the total, the percentage formula page shows the conversions.
Exam checklist for statistics questions
- Write the formula first, then a line listing with their values. Examiners often give step marks for this.
- Draw the cumulative frequency column before naming the median class.
- Mode uses the class with the highest frequency; median uses the class where cf crosses . They are often different classes.
- In assumed mean questions, any works, but a middle class mark keeps numbers small.
- Round only the final answer, usually to two decimal places.
Measures of spread (range, mean deviation, variance, SD) follow in class 11. The complete formula list gives you one sheet of revision across chapters.
Download the PDF
Questions students ask
What is the median formula for grouped data?
Median , where l is the lower limit of the median class, n the total frequency, cf the cumulative frequency of the previous class, f the frequency of the median class and h the class width.
What is the mean median mode formula relation?
For moderately skewed data, Mode Median Mean, also written Mean Mode (Mean Median). It is approximate, not exact.
How do I find the median when n is even?
Sort the data, then average the two middle values, the -th and the -th. For 2, 4, 9, 11 the median is .
Can a data set have no mode or more than one mode?
Yes. If every value appears once, there is no mode. If two values tie for the highest count, the data is bimodal, for example 1, 2, 2, 3, 3, 4 has modes 2 and 3.
Which is better, mean or median?
The mean uses every value, so it suits evenly spread data. The median ignores extremes, so it is better for skewed data like incomes. Report both when unsure.
Which chapter covers mean, median and mode?
The Statistics chapter of NCERT class 10 covers mean, median and mode of grouped data. Class 11 Statistics then moves on to measures of spread, and class 11 Sequences and Series covers the arithmetic and geometric means. The harmonic mean appears mostly in competitive exam books.