
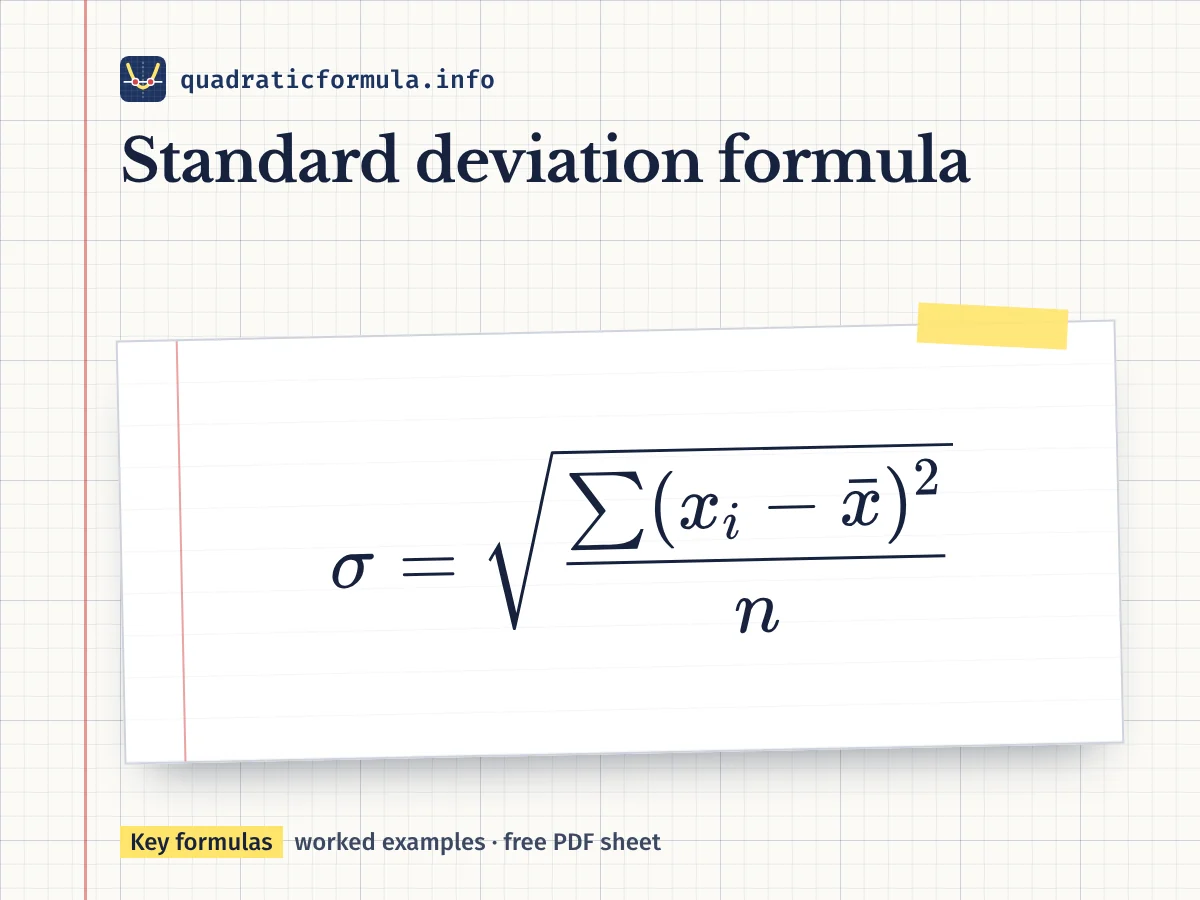
The standard deviation formula for a population is , and for a sample you divide by instead of . Standard deviation tells you roughly how far the values typically sit from their mean. Square it and you get the variance.
Below you get every version you meet from class 10 to college: raw data, the shortcut form, grouped data by the direct, assumed mean and step deviation methods, plus mean deviation, quartile deviation, coefficient of variation and a short note on covariance. Each method has a worked table you can follow line by line, and the statistics calculator below checks your own data.
Key formulas
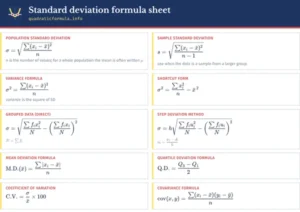
Population standard deviation
n is the number of values; for a whole population the mean is often written
Sample standard deviation
use when the data is a sample from a larger group
Variance formula
variance is the square of SD
Shortcut form
Grouped data (direct)
Step deviation method
Mean deviation formula
Quartile deviation formula
Coefficient of variation
Covariance formula
The standard deviation formula, symbol by symbol
Finding the standard deviation using average formulas in maths is a two-step job: first average the values, then average the squared distances from that average. So the variance formula in maths is the core, and the standard deviation math formula is just its square root. Read the formula from the inside out. Each piece has one job.
- is one observation, the i-th value in your list.
- (read "x bar") is the arithmetic mean of the data. See the mean, median and mode page if you need a refresher on finding it.
- is the deviation of that value from the mean. Some deviations are negative, and the deviations always add up to zero, which is why we square them.
- means add the squared deviations for all values.
- is the number of values. Dividing by gives the variance, the average squared deviation.
- The square root brings the answer back to the same unit as the data. If the data is in kg, the standard deviation is in kg, and the variance is in kg squared.
The Greek letter (sigma) is used for the population standard deviation and for its variance. Many books use for the sample version. A small standard deviation means the values are packed close to the mean. A large one means they are spread out.
Population vs sample: n or n minus 1
School textbooks in India, including NCERT class 11, divide by . They treat the data you are given as the whole group. In college statistics, economics and most exam questions that say "sample", you divide by .
| Case | Variance | When to use |
|---|---|---|
| Population | You have every member of the group (all 40 students in a class) | |
| Sample | You picked a few members to estimate the spread of a larger group |
Why ? A sample's own mean sits closer to its values than the true population mean does, so the squared deviations come out a little too small. Dividing by one less than corrects this. Statisticians call the degrees of freedom. For large the two answers are almost the same.
Worked example: standard deviation of ungrouped data
Find the variance and standard deviation of 4, 8, 6, 10, 12
Step 1. Mean: .
Step 2. Build the working table.
| 4 | 16 | 16 | |
| 8 | 0 | 0 | 64 |
| 6 | 4 | 36 | |
| 10 | 2 | 4 | 100 |
| 12 | 4 | 16 | 144 |
| Total 40 | 0 | 40 | 360 |
Step 3. Population variance , so .
Step 4. Sample variance , so .
Check with the shortcut: . Same variance.
Answer: variance 8 and SD about 2.83 (population); variance 10 and SD about 3.16 (sample).
The shortcut formula for variance
Expanding the square in the definition gives a version that skips the deviation column:
In words: the mean of the squares minus the square of the mean. It is faster when the mean is a messy decimal such as 23.47, because you never subtract it from each value. The sample version of the shortcut is .
Watch out: means square each value first and then add. means add first and then square. Mixing these up is the most common slip in board papers.
Grouped data: direct, assumed mean and step deviation methods
For a frequency table, each class is represented by its mid-value and every term is weighted by its frequency . There are three routes, and all give the same answer:
- Direct method: .
- Assumed mean method: pick a convenient middle value , let , then . Shifting all values by does not change the spread.
- Step deviation method: also divide by the class width : , then .
The step deviation method formula is the same idea as the one used for the mean in class 10, where . Here you also need the column, and you multiply by at the end because variance is in squared units.
Standard deviation of a frequency distribution
Marks of 40 students: 0 to 10 (5 students), 10 to 20 (8), 20 to 30 (15), 30 to 40 (10), 40 to 50 (2). Take and .
| 5 | 5 | 20 | ||
| 15 | 8 | 8 | ||
| 25 | 15 | 0 | 0 | 0 |
| 35 | 10 | 1 | 10 | 10 |
| 45 | 2 | 2 | 4 | 8 |
| Total | 40 | 46 |
Mean: .
Variance: .
By the direct method you would find and , so . With alone, and , giving . All three agree.
Answer: mean 24 marks, variance 114, standard deviation marks.
Mean deviation formula
Mean deviation uses absolute values instead of squares. It is the average distance of the values from a central value, usually the mean or the median:
For the data 4, 8, 6, 10, 12 with mean 8, the absolute deviations are 4, 0, 2, 2, 4. Their total is 12, so M.D. about the mean . The median here is also 8, so the mean deviation about the median is the same. Notice that 2.4 is smaller than the SD of 2.83. Mean deviation is never larger than the population standard deviation.
Quartile deviation and coefficient of variation
Quartile deviation (also called the semi-interquartile range) looks only at the middle half of the data, so a few extreme values do not disturb it. For n sorted values, take as the -th value and as the -th value.
Quartile deviation of eleven values
Data: 3, 5, 7, 8, 10, 12, 13, 15, 18, 20, 22. Here , so is the 3rd value, 7, and is the 9th value, 18.
and the coefficient of quartile deviation .
Answer: Q.D. is 5.5.
Coefficient of variation compares spread across data sets with different means or units. A lower C.V. means more consistent data.
Which batter is more consistent
Batter P: mean score 50, SD 15. Batter Q: mean score 40, SD 8.
C.V. of P . C.V. of Q .
Answer: Q is more consistent, even though P scores more on average.
Covariance in brief
Variance measures how one variable spreads. Covariance measures how two variables move together. A positive value means that when x is above its mean, y also tends to be above its mean.
Example: x = 1, 2, 3, 4, 5 and y = 2, 4, 5, 4, 5. Here , and , so . Divide by for sample covariance, which gives 1.5. Dividing covariance by gives the correlation coefficient, which you meet in statistics for economics.
Common mistakes and exam tips
- Forgetting the square root. Variance and SD are different answers; read which one the question wants.
- Using class limits instead of mid-values in grouped data. Always use .
- Dividing by the number of classes instead of .
- In the step deviation method, forgetting to multiply the bracket by (or the root by ).
- Rounding the mean early. Keep fractions until the last step, or use the shortcut form.
- Using in a class 11 board answer where NCERT expects , or the reverse in a college sample question.
A useful property for MCQs: adding a constant to every value leaves the SD unchanged, while multiplying every value by k multiplies the SD by and the variance by . For other topics in the same revision session, the all maths formulas page lists the key results chapter by chapter, and the percentage formula page helps when the C.V. needs to be written as a percent.
Download the PDF
Questions students ask
What is the formula of standard deviation?
For n values with mean , . For a sample, replace n with . For grouped data, weight each squared deviation by its frequency and divide by .
What is the difference between variance and standard deviation?
Variance is the mean of the squared deviations; standard deviation is its square root. SD has the same unit as the data, so it is easier to interpret. If the variance is 25, the SD is 5.
Which class teaches the standard deviation formula?
NCERT introduces mean deviation, variance and standard deviation in class 11 in the Statistics chapter. Class 10 works only with averages of frequency tables, and the step deviation method first appears there for the mean.
Can standard deviation be negative or zero?
It cannot be negative, because it is a square root of a sum of squares. It is zero only when every value is the same, for example 7, 7, 7, 7.
When should I use the step deviation method?
Use it for grouped data with equal class widths and large mid-values. Dividing by h turns the numbers into small integers like , which keeps the arithmetic short and the mistakes few.
Is mean deviation the same as standard deviation?
No. Mean deviation averages the absolute deviations, while SD squares them, averages and takes a root. For 4, 8, 6, 10, 12 the mean deviation is 2.4 and the SD is about 2.83.